· FocusCurve Team · Methylphenidate · 13 min read
Reviewed against FDA prescribing information (DailyMed) and peer-reviewed pharmacokinetic studies. Every plotted curve is schematic and normalized to its own peak, not to clinical scale.
Updated:
Ritalin IR vs LA vs Concerta: Comparing the PK Curves
Why does one 20mg dose hit like a rollercoaster while another lasts all day? An architectural breakdown of spikes, double humps, and laser-drilled osmotic pumps.
Not medical advice. This article is educational pharmacology, not a diagnosis or individualized treatment recommendation. Medication decisions belong with a qualified clinician.
If you have ever compared Ritalin IR, Ritalin LA, and Concerta, you have probably read that one lasts “about 4 hours,” another “about 8,” and the third “about 10 to 12.” Those numbers are true, but they hide the more useful story: the three formulations do not just last for different lengths of time, they rise and fall in completely different shapes.
This article is a companion to our general duration guide, How Long Does Ritalin Last? IR vs LA vs Concerta. Where that article answers “how long,” this one is about the curves themselves — how to read a plasma methylphenidate profile, what each delivery system does to the shape, and how the shape (not just the duration) is what you might actually weigh when you talk formulation options over with your prescriber.
Every number here comes from FDA prescribing information or peer-reviewed pharmacokinetic research. Every graph is schematic: each curve is normalized to its own peak so you can compare shapes and timing, not heights. The underlying studies used different products and different doses, so comparing absolute levels across them would be misleading.
Apply the comparison with the Ritalin tracker, or explore population models for Ritalin LA and Concerta in the bedtime calculator. Individual timing can differ substantially.
A note on the graphs below: each y-axis shows the medication level as a percentage of that formulation’s own peak, and each curve is a schematic drawn from the FDA label timing values. They illustrate shape and timing, not exact levels, and they are not to clinical scale. Your real curve depends on your body.
| Formulation | Release architecture | Peak profile | Food note | Observed duration |
|---|---|---|---|---|
| Ritalin IR | Immediate-release tablet | Single peak near 2 hours | No meaningful interaction reported | About 3–4 hours |
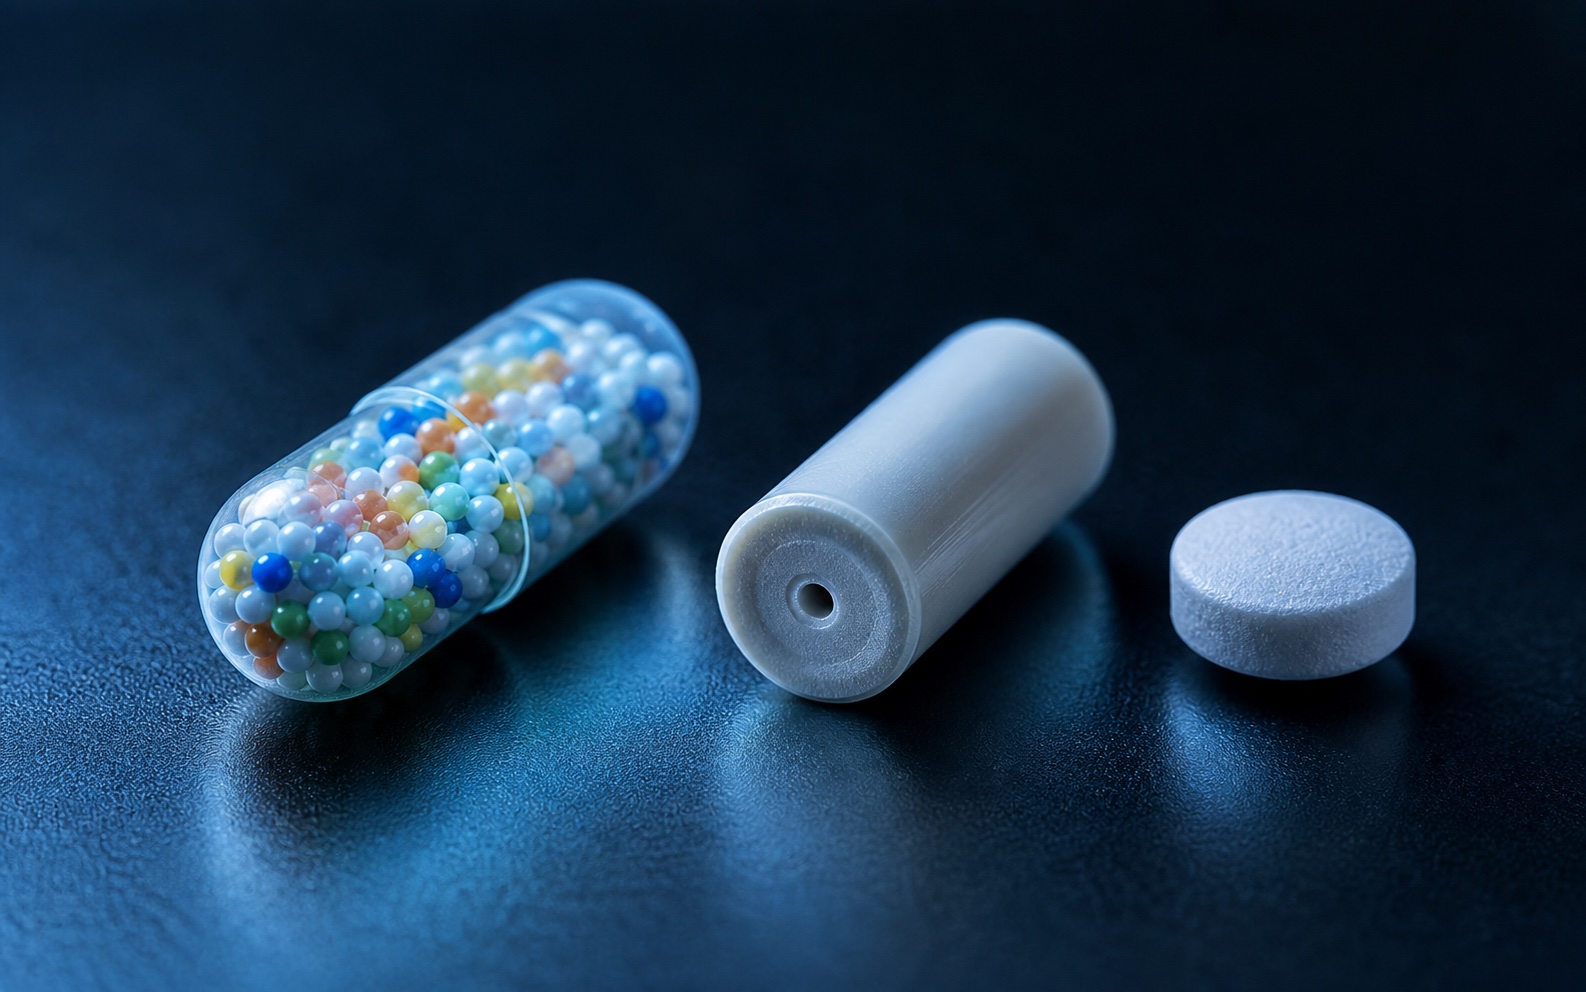
| Ritalin LA | 50:50 SODAS immediate-release and polymer-coated delayed-release beads | Two peaks about 4 hours apart | High-fat meals can alter peak timing and lower the second peak | About 8 hours |
| Concerta | 22% immediate-release overcoat + 78% OROS release through a precision laser-drilled aperture | Early peak near 1 hour; broad peak near 6–7 hours | Labeled for use with or without food | About 10–12 hours |
| Medikinet CR | 50:50 immediate-release and enteric-coated modified-release pellets | Biphasic profile with a second rise about 3 hours later | Requires administration with or after a solid breakfast | About 8 hours |
| Focalin XR | SODAS 50:50 immediate/delayed beads containing pure d-threo-methylphenidate | Biphasic profile with peaks about 4 hours apart | High-fat meals may alter peak timing; follow the product label | About 12 hours |
How to read a medication curve
A pharmacokinetic curve plots how much medication is circulating over time. Reading one comes down to four features: the onset (how steeply the line rises), the peak (how high and how soon), the shape of the middle (a single point, a plateau, two humps, or a rising ramp), and the offset (how gently the tail comes down). Duration is just the total width above a meaningful level.
For methylphenidate, the raw molecule is the same in all three products, and its half-life is short — roughly 2.2 hours for the active d-methylphenidate component (Focalin FDA label; PMC2671958). That short half-life is the key to the whole comparison: if the molecule clears so quickly, then any product that lasts longer than a few hours is doing so because its delivery system keeps feeding new drug in. The curve shape is really a picture of the delivery system at work.
Ritalin IR: the single sharp peak
Immediate-release methylphenidate produces the simplest curve of the three: a single, relatively narrow peak. The direct Ritalin label reports a plasma peak at approximately 2 hours; the Focalin label reports 1 to 1.5 hours for the active d-isomer, so estimates vary by product and study design (Ritalin DailyMed label; Focalin FDA label). From there the level declines in step with the drug’s short half-life of roughly 2.2 hours, so a single dose typically fades noticeably within about 3 hours and is largely gone within roughly 4 to 5 hours. Ritalin IR labeling reports no relevant food effect on absorption.
There is no delivery system slowing anything down. You swallow the tablet, it dissolves, the drug is absorbed, and it leaves on the schedule set by the molecule’s own half-life. That is why the immediate-release curve is the tallest-per-dose and the narrowest, and why people who rely on it often take two or three doses across a day to cover the gaps.
Ritalin IR: one narrow peak near 2 hours
Ritalin LA: the double hump
Ritalin LA is engineered to imitate two immediate-release pulses about four hours apart, and its curve shows exactly that: two distinct humps. The capsule uses SODAS (Spheroidal Oral Drug Absorption System) technology: a 50/50 mix of immediate-release beads and polymer-coated, delayed-release beads. The FDA label describes the result as a “bi-modal plasma concentration-time profile (i.e., 2 distinct peaks approximately 4 hours apart)” (Ritalin LA FDA label).
In the label’s adult data, the first peak arrives at about 2 hours and the second at about 5.5 hours (roughly 2 and 6.6 hours in children). A detail worth noticing: in adults the second hump is actually a touch higher than the first, not lower. So the accurate shape is two comparable peaks with a shallow dip between them at roughly 3.5 to 4 hours, with the whole profile fading by about 8 hours. If your medication seems to briefly wane mid-morning and then return, that dip is not your imagination — it is built into the curve.
Ritalin LA: two peaks about 4 hours apart
Concerta: the ascending ramp
Concerta produces the most distinctive shape of the three: not a peak followed by a decline, but a slow climb to a broad late maximum. The FDA label describes it precisely — after an “initial maximum concentration at about 1 hour,” plasma methylphenidate follows “gradual ascending concentrations over the next 5 to 9 hours, after which a gradual decrease begins” (Concerta FDA label). In the adult label data, the overall peak lands near 6.8 hours.
This is the work of the OROS osmotic delivery system. About 22% of the dose sits in an outer coat that releases immediately, giving that small early bump near 1 hour; the remaining 78% is pushed out through a precision laser-drilled aperture at a gradually increasing rate over roughly 10 to 12 hours. The result is a single, wide, right-shifted curve. Because the delivery is osmotic rather than dependent on stomach contents, the shape is also notably food-independent: the CAFE study found Concerta’s exposure was not meaningfully changed by a high-fat breakfast (Auiler et al., 2002).
Concerta: a rising ramp to a broad late peak
All three on one axis
Placing the three curves on a single timeline makes the design choices obvious. Immediate-release is a quick spike; Ritalin LA is two spikes stitched together; Concerta is a slow wave. Each was engineered to solve the same problem — methylphenidate’s short half-life — in a different way.
Remember that these curves are each normalized to their own peak, so the graph compares shape and timing, not strength. What it shows well is when coverage arrives and how it is distributed across the day: front-loaded and brief for IR, split into two blocks for LA, and back-loaded into a long single sweep for Concerta.
Ritalin IR vs LA vs Concerta: shape and timing
Why Concerta climbs during the day
Concerta’s rising shape is not an accident of the osmotic hardware — it was a deliberate design goal. Early research by Swanson and colleagues found that a flat, steady level of methylphenidate tended to lose its effect as the day went on, a phenomenon called acute tolerance or tachyphylaxis, while a gradually ascending level maintained the afternoon response (Swanson et al., 1999). In practical terms, the ascending ramp is designed to maintain efficacy as acute DAT tolerance develops rather than allowing exposure and effect to remain flat.
That finding shaped a generation of long-acting stimulants. As Swanson later summarized, the goal for once-daily products was an ascending profile so that the afternoon exposure met or exceeded the morning exposure, keeping effect steady rather than letting it drift down (Swanson, 2005). Concerta’s 22%-immediate, 78%-ascending design is the direct product of that idea. It is a useful reminder that a medication curve is not just chemistry — it is a design decision about how you want your day covered. (This is background on why the curve is shaped as it is, not guidance about dosing; those choices belong with your prescriber.)
Matching the curve to your day
Once you can read the shapes, the practical question stops being “which is strongest” and becomes “which distribution of coverage fits my day” — a question for you and your prescriber, not something any curve decides on its own. Effectiveness, side effects, sleep, and how your body handles the drug all matter as much as the shape. With that firmly in mind, here is what the geometry alone tends to imply, purely as background for that conversation:
- Dosing frequency. The immediate-release spike is brief, which is why it is often taken more than once a day; Ritalin LA and Concerta are built as once-daily curves. If remembering a mid-day dose is a genuine problem, the shape of a once-daily curve is relevant context to raise.
- Where the coverage sits. A double hump (LA) front-loads two blocks into roughly the first 8 hours; an ascending ramp (Concerta) pushes the strongest coverage into the late morning and afternoon. Which pattern matches when you most need focus is worth noticing.
- The tail and sleep. The later and broader the curve, the later it fades. A curve that peaks at 6 to 7 hours naturally reaches further into the evening — relevant if you are sensitive about sleep. We cover this in depth in Can’t Sleep After Taking ADHD Medication?.
- Food and consistency. Concerta’s osmotic curve is largely food-independent, while the bead-based products can shift with a large meal (Ritalin LA label).
- Your own biology. Methylphenidate is cleared mainly by the CES1 enzyme (StatPearls — Methylphenidate), and genetic and age differences mean two people can get noticeably different curves from the same product. The population-average curve is a starting point, not a guarantee.
Frequently asked questions
What is the difference between the Ritalin LA and Concerta curves?
Both are extended-release methylphenidate, but their curves have different shapes. Ritalin LA uses SODAS: a 50:50 split of immediate-release and polymer-coated delayed-release beads that produces two peaks about 4 hours apart. Concerta uses OROS: a 22% immediate-release overcoat and 78% ascending osmotic release through a precision laser-drilled aperture over 10 to 12 hours, producing a broad late peak around 6 to 7 hours.
Why does Concerta build up during the day instead of staying flat?
Concerta is designed with an ascending release profile to help maintain efficacy as acute DAT tolerance develops during the day. Research by Swanson and colleagues found that a flat, steady methylphenidate level could lose effect over time, while a gradually rising level maintained afternoon response. Concerta delivers 22% immediately as an overcoat and the remaining 78% through an ascending OROS release.
Which methylphenidate formulation has the longest duration?
Among the three formulations shown here, Concerta has the broadest labeled duration at about 10 to 12 hours. Ritalin LA provides roughly 8 hours through its two-pulse SODAS system, while immediate-release Ritalin provides roughly 3 to 4 hours per pulse. These are approximate population observations, and duration alone does not make one formulation better for every person.
Are these medication curves the same for everyone?
No. The curves shown here are population averages, and individual timelines vary widely. Methylphenidate is broken down mainly by CES1, while age and formulation affect the observed profile. Ritalin IR has no meaningful food interaction in its label, whereas a high-fat meal can alter Ritalin LA peak timing and height. Treat any curve as a starting picture, not a promise.
References
- Focalin (dexmethylphenidate) FDA Prescribing Information — DailyMed. dailymed.nlm.nih.gov
- Ritalin (methylphenidate hydrochloride) tablets prescribing information — DailyMed. dailymed.nlm.nih.gov
- Focalin XR (dexmethylphenidate hydrochloride) prescribing information — DailyMed. dailymed.nlm.nih.gov
- Medikinet XL modified-release capsules Summary of Product Characteristics — emc. medicines.org.uk
- Ritalin LA (methylphenidate ER) FDA Prescribing Information — DailyMed. dailymed.nlm.nih.gov
- Concerta (methylphenidate ER) FDA Prescribing Information — DailyMed. dailymed.nlm.nih.gov
- Methylphenidate — StatPearls (NCBI Bookshelf). ncbi.nlm.nih.gov
- Liu F, Minami H, Silva RR. Dexmethylphenidate hydrochloride in the treatment of attention deficit hyperactivity disorder. Neuropsychiatr Dis Treat. 2006;2(4):467-473 (PMCID PMC2671958). pmc.ncbi.nlm.nih.gov
- Swanson J, Gupta S, Guinta D, et al. Acute tolerance to methylphenidate in the treatment of ADHD in children. Clin Pharmacol Ther. 1999;66(3):295-305 (PMID 10511066). pubmed.ncbi.nlm.nih.gov
- Swanson JM. Long-acting stimulants: development and dosing. Can Child Adolesc Psychiatr Rev. 2005 (PMC2547091). pmc.ncbi.nlm.nih.gov
- Auiler JF, Liu K, Lynch JM, Gelotte CK. Effect of food on early drug exposure from extended-release stimulants (CAFE study). Curr Med Res Opin. 2002;18(5):311-6 (PMID 12240794). pubmed.ncbi.nlm.nih.gov
Medical disclaimer
This article is for educational and informational purposes only. It is not medical advice, diagnosis, or treatment. The information presented is based on published research from FDA-approved prescribing information, peer-reviewed pharmacokinetic studies, and NCBI Bookshelf references, but it is simplified for a general audience and does not capture the full complexity of individual pharmacokinetics.
All half-lives, timelines, and percentages discussed are approximate population averages. Your individual experience may differ significantly based on your genetics, metabolism, body composition, other medications, and many other factors.
Do not start, stop, or change your medication based on this article. Always talk to your prescriber or doctor before making any changes to your treatment plan.
FocusCurve is a visualization and educational tool -- not a medical device. It does not provide medical advice, diagnosis, or treatment recommendations. All estimates shown in the app are approximate, based on generalized models and published population-average parameters.
- Pharmacokinetics
- Curves
- Concerta
- Ritalin